SkyFusion Homes
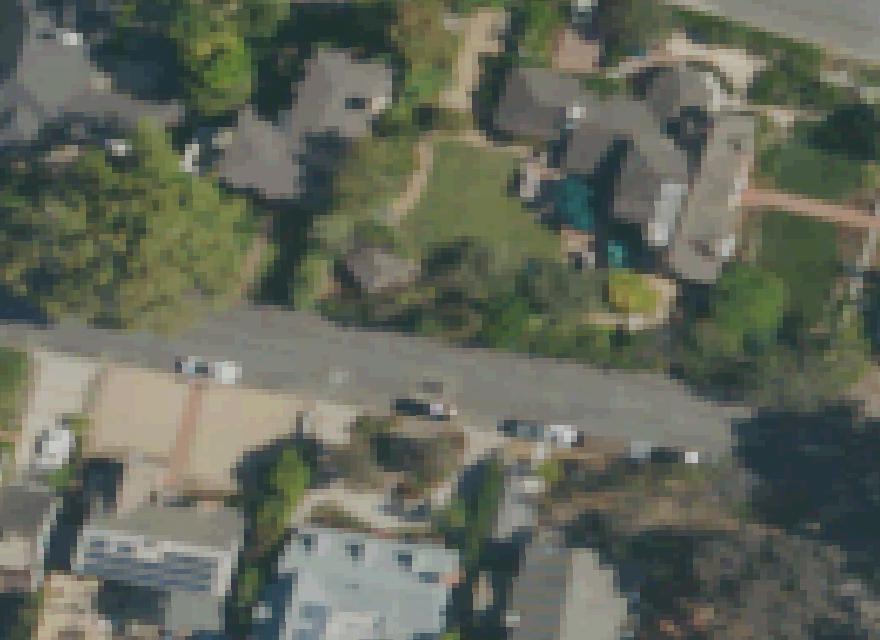
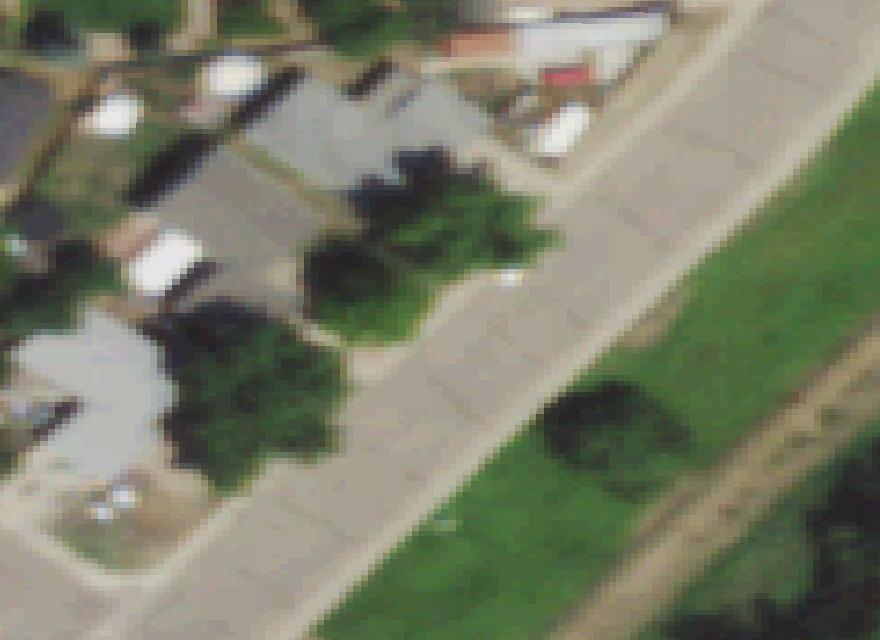
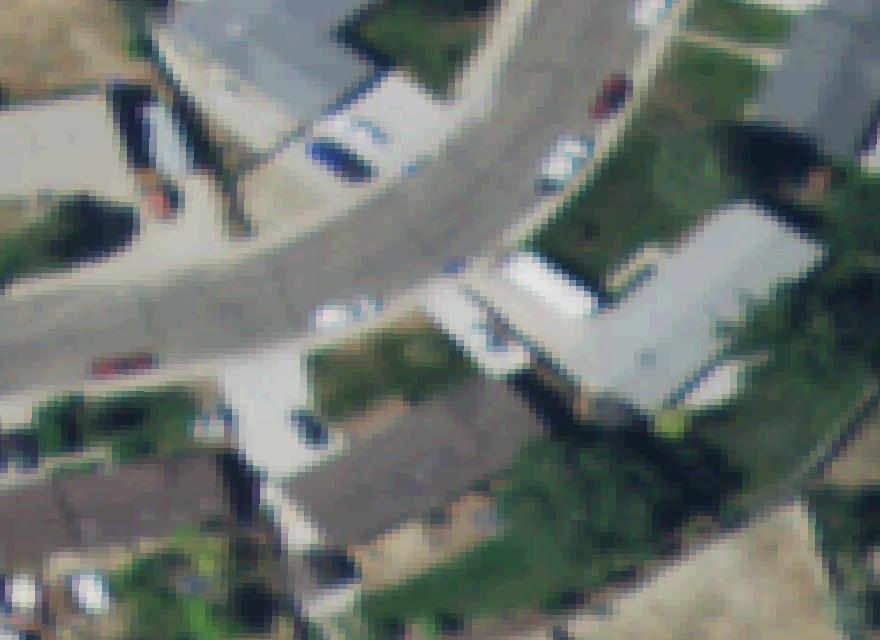
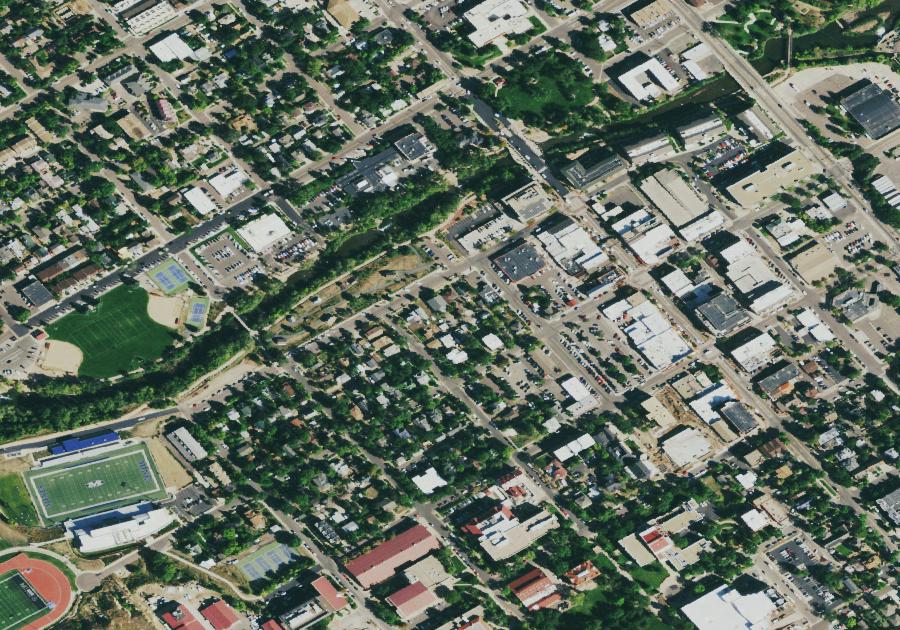
Aerial view of American rooftops
United States · Coast to Coast

Every roof in America, scored by the sun.

Federal scientists laser-scanned millions of American rooftops. We turned those public measurements — and live sun modeling for every home the lasers haven't reached — into a Sun Score: how much roof you have, which way it faces, and how much power it could make. Type your address — if your page isn't built yet, we'll create it on the spot.
10,057homes scored
32states and counting
103.5 MWof rooftop potential
63average Sun Score

Sun Scores across America

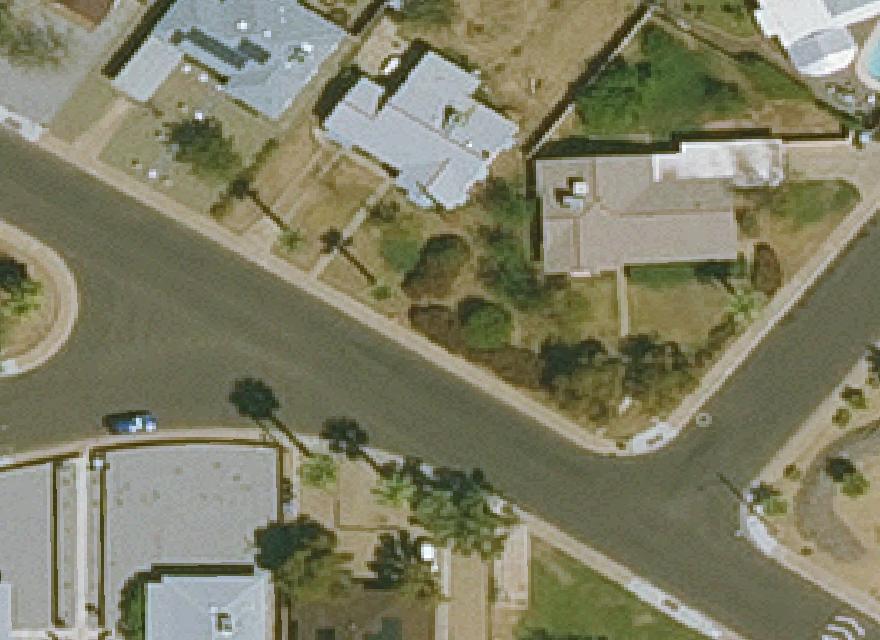
Sample homes from the 32 states we've scored so far — every one has its own page with its roof photo, Sun Score and full cost estimator. Golden, Colorado is our laser-measured hometown dataset; its sunniest streets are just below.

Sunniest streets — Golden, our measured hometown

Average Sun Score by street (3+ scored homes). Ridge lines and lot orientation do quiet work here.

StreetAvg scoreHomesPotential
Jackson Pl84.122494 kW
Jackson Dr83.05103 kW
Zodiac St82.4573 kW
Tucker Gulch Dr82.39274 kW
Fox Hollow Ln82.216343 kW
Elm Cir82.26234 kW
Choke Cherry Ct81.89164 kW
Valley View Ct81.713240 kW
W Colfax Ave81.56192 kW
Anvil Way81.56128 kW
Ptarmigan St81.47157 kW
Fossil Trace Dr81.419582 kW

How a Sun Score works

Three public ingredients, one published recipe.

STEP 1 — MEASUREDLasers measured your roofNREL's PV Rooftop Database holds LiDAR-measured roof planes — area, slope, and facing — for millions of homes across 128 U.S. metro areas, from federal aerial scans.
STEP 2 — MODELEDYour sunshine, plane by planeEach plane is run against its own local sun resource: south-facing planes earn the most, shaded or north-facing the least, sized with modern panels. Homes the lasers haven't reached get a live modeled score from their location.
STEP 3 — YOURSRefresh it with today's sky2012 was a while ago. Any home's page can pull a fresh, tree-level analysis with current imagery — that's the full report.