2901 Ralston Avenue
Indianapolis, IN 46218 · Single Family Home - Detached · Modeled Sun Score — a regional estimate; this roof has not been laser-measured yet.
Workable for solar.
Modeled from IN solar-resource data and this home's type — worth roughly 12,032 kWh a year at the region's typical yield. A measured scan refines it with the roof's real planes, tilts and shading.
Want real quotes for this roof?
Our numbers are estimates. Up to 4 local installers can bid on this exact roof — with its Sun Score and measurements already attached.
Get quotes from up to 4 installers →Where this home is
Indianapolis, IN — the pin is this home. Satellite view shows the roof in context; switch to Streets for the neighborhood map.
Through the year
Roofs here make their hay in late spring and summer. Typical seasonal pattern for this system:
What a measured scan adds
This page is a modeled estimate. A LiDAR measurement — or an installer's site survey — replaces it with this roof's real planes: exact tilts, facings, usable areas and shading, and a refined Sun Score.
What would it cost?
Rough 2026 pricing for this roof — pick a size, add backup, compare cash, loan and lease. Illustrative estimates, not a quote.
Your bill — with and without solar
Upfront cost $0 — SkyFusion funds the Max-roof system, a 48-hour battery bank and the node itself. Your electric bill $0 — this roof makes 12,032 kWh a year at max size, more than a typical home uses. And the AI Prosperity Dividend: $100–$300/mo paid to you for hosting the node (illustrative — final terms from SkyFusion).
Estimator assumptions: $2.85/W installed (2026 national average) · battery $12,500 per 13.5 kWh unit purchased, whole-home backup at average use · loan 7.5% APR (the median quoted solar-loan rate), term selectable · lease priced per kWh produced plus $60/mo per battery unit, first-year payment (leases typically escalate ~3%/yr) · typical home use 10,000 kWh/yr · power valued at $0.16/kWh · no federal homeowner credit in 2026 (it expired Dec 31, 2025); third-party leases can still benefit from the commercial credit. Payback math: power prices rise at the rate picked above (3%/yr default), panels fade 0.5%/yr, surplus beyond home use at ≈$0.02/kWh (typical utility year-end payout; rollover banking keeps credits at retail where offered), battery time-shifting at ≈$0.09/kWh on time-of-use spreads where offered. Each EV adds ≈3,300 kWh/yr (≈12,000 miles at 0.275 kWh/mile); the ≈$1,200/yr per-EV gas saving (30 mpg, $3/gal) is context only and is not counted in any payback.
These are estimates, not a quote. Every number on this page is modeled from aerial imagery and public data. Your actual price and savings will depend on the final system design an installer prepares after a site survey — panel and inverter selection, your roof’s real condition, pitch and shading, electrical panel capacity, permitting, and the incentives in effect when you install. Quotes vary from installer to installer, which is exactly why the button above sends your roof to up to four of them.
How this home compares
This roof scores 54. The average scored home in Indianapolis, IN is 54 across 13 published homes — putting this roof ahead of about 0% of them. Across IN, the average is 54 over 61 scored homes. Scores run 0–100: south-facing, unshaded roof area earns the most; small or north-heavy roofs earn the least.
Nearby homes, scored
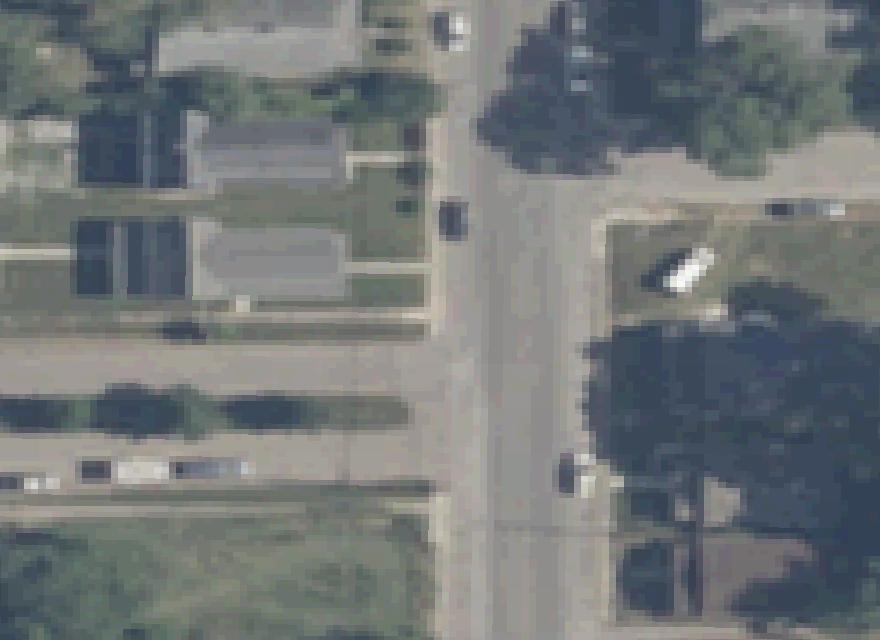
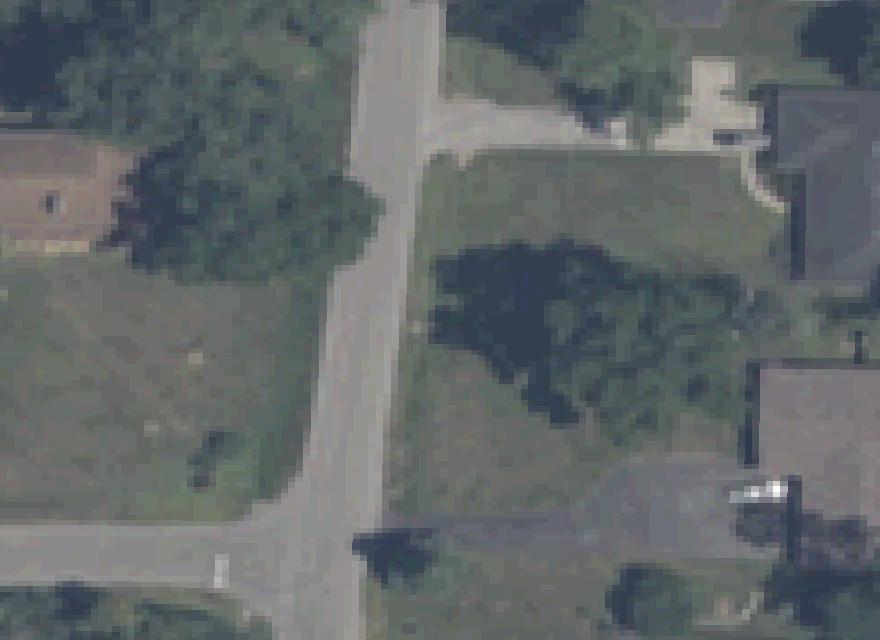
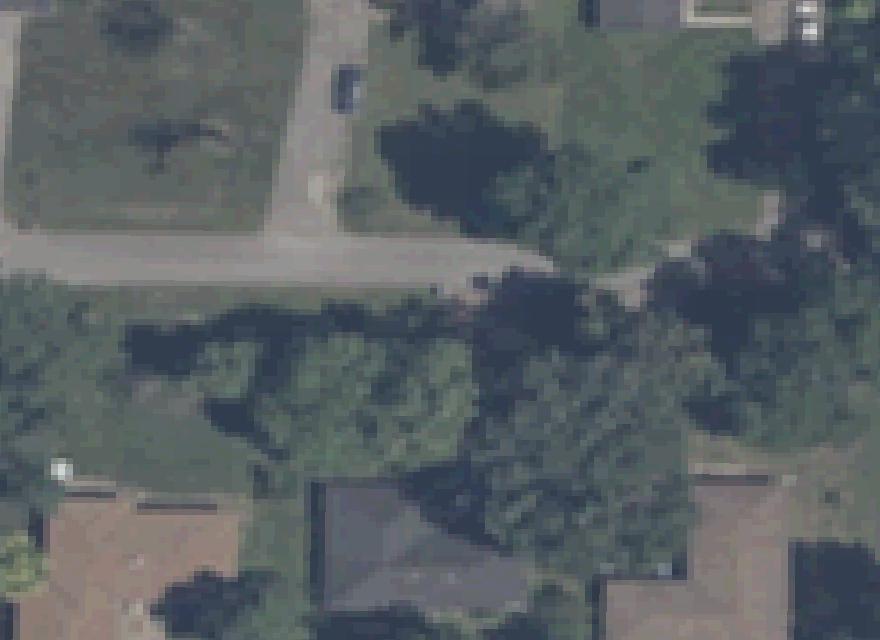
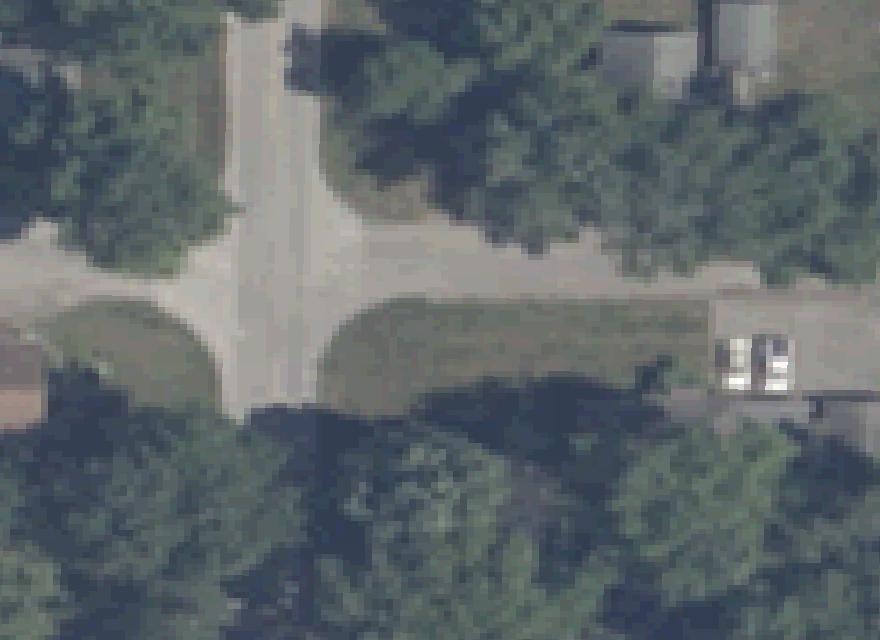
Other roofs we have scored near this one — see how the whole neighborhood does in the sun.


Questions about this roof
This is a modeled estimate: a 9.4 kW system at 2901 Ralston Avenue in Indianapolis, IN could produce about 12,032 kWh per year, using the region's typical solar yield of 1280 kWh per kW installed (NREL PVWatts-typical). This roof has not been laser-measured yet, so treat it as a strong first approximation.
A Sun Score rates a roof's solar potential from 0 to 100. This score is MODELED — built from regional solar-resource data and the home's type, not from measured roof planes. 2901 Ralston Avenue scores 54/100. When the roof is measured (LiDAR or a site survey), the score is refined with its real planes, tilts and shading.
A typical roof on a home like this fits about 9.4 kW of panels. The exact fit depends on the roof's real planes, obstructions and shading — which is what a measured scan or an installer's site survey confirms before any quote.
No. These figures are modeled estimates built from public data — regional solar resource (NREL), address records (US Census) and aerial imagery (USGS). A quote comes from an installer's design after the actual roof is measured.